
Dear Clients,
The second quarter kicked off with a whimper. The Dow Jones Industrial Average and S&P 500 on Monday fell more than 200 points and 0.2%, respectively, while the Nasdaq Composite closed marginally higher. Those moves came as Treasury yields popped on the back of stronger-than-expected U.S. manufacturing data, which raised questions about how many times will the Federal Reserve will cut rates. The indexes had an even more significant drop on Tuesday, as higher rates for longer and strong data across the GDP spectrum further drove some selling after this incredible runup. My gut feeling, is that needing cash for tax filing (as has often been the case in past years), has further driven some selling, though markets are typically better the second half of April.
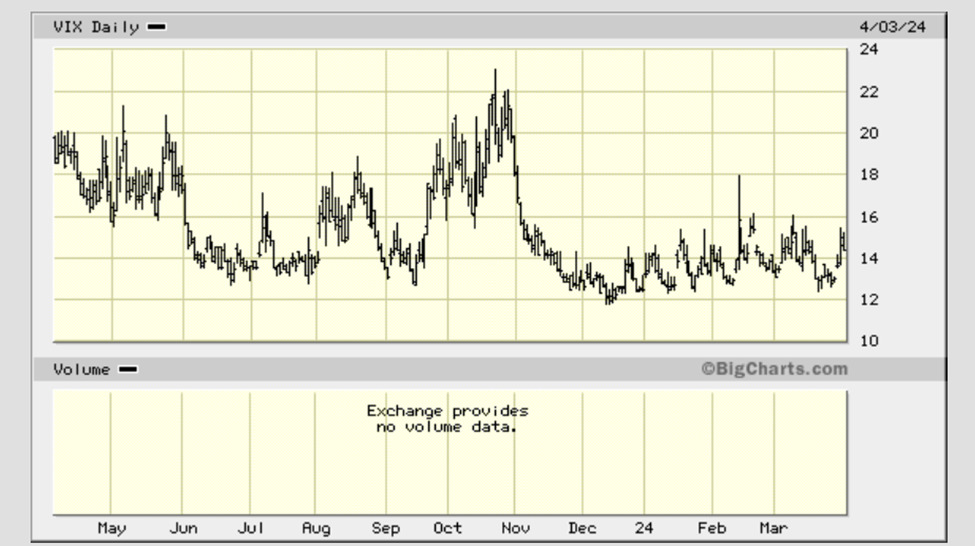
The stock market rally has been nothing short of amazing reflecting the strong underlying economy and strong earnings companies reported in Q1. But there comes a point where the party boat is just too packed and some of the party-goers need to be thrown overboard! You’ve heard me talk about when the sentiment gets to “one sided,” that is often a good time to play the contrarian. Virtually all sentiment gauges show too much bullishness right now. The AAII sentiment gauge (one of the most followed) has gotten very bullish. Additionally, other sentiment gauges like the VIX (lower VIX depicts less fear) is also showing too much complacency and bullishness in the short-term, in my opinion as depicted below.
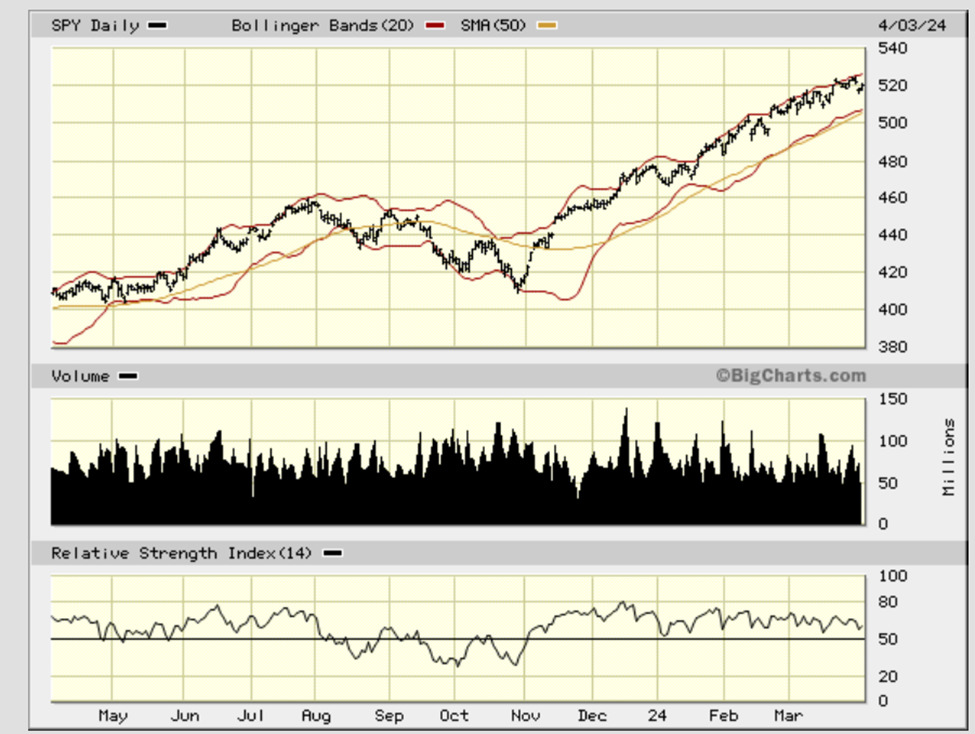
Another gauge I watch closely, is the 50-Day average. You rarely see a market above the 50-Day average as we have the past five months. This is also depicted by the Relative Strength Indicator (RSI) which has also stayed at around 60 or so for some time, which typically means overbought in short term.
So while certain sentiment gauges and the S&P as a whole have gotten a little rich in my opinion in the short-term, the S&P 500 posted its best first-quarter performance going back to 2019, up 10%, as stocks rode a wave of enthusiasm around the prospect of rate cuts coming later this year, as well as the potential of artificial intelligence to bolster corporate profits.
Nvidia, the poster child for the AI rally, is up more than 80% in the first quarter. The VanEck Semiconductor ETF (SMH) has leapt nearly 30% in the period. Meanwhile, the Dow Jones Industrial Average is a stone’s throw away from reaching 40,000 for the first time ever. Those gains have many advisors/investors deliberating whether the rally can continue in the second quarter, or if stocks are due for some sort of consolidation — even a correction — over that period. Many stocks are triggering overbought signals. Some macroeconomic observers worry the strain on consumers from higher-for-longer interest rates will soon be felt in the economy. The stock market has rallied so sharply that we are technically overbought into this extension and some sort of pullback is likely, in my opinion. And many people don’t know (according to ChatGPT) that we have had an S&P 10% correction every 1.2 years back to 1980. I am working on some hedges in our wealth management portfolios in preparation. An example might be a hedged investment where you are protected totally on a 15% selloff, but gains are also capped at about 15% in one year, on this investment. Another way to hedge portfolios, is through covered calls which I do in many larger accounts, and through ETFs in other accounts. These type of hedges, “keep one in the game” while also protecting the downside after accumulating nice gains.
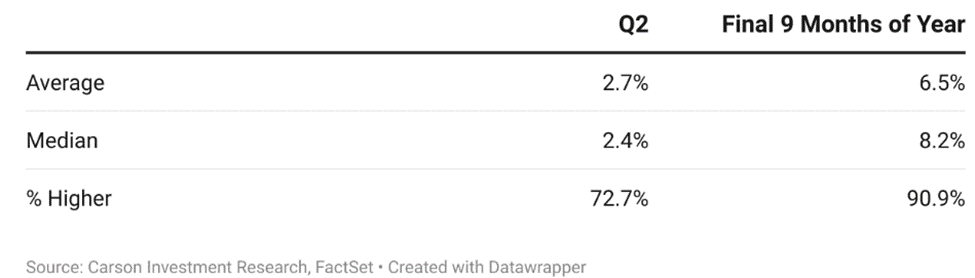
In the longer term, it appears as though the party can continue a while longer. At least that is what the analytics point too, as in the last 10 out of 11 prior instances when the S&P 500 registered a first-quarter gain of 10% or more, the broad market index was higher for the remainder of the year, according to Ryan Detrick, chief market strategist at Carson Group. Specifically, in the second quarter, the S&P 500 was higher 9 out of 11 times, averaging a 2.7% gain.
To be sure, April tends to be a good month for stocks, with the S&P 500 averaging a 1.5% gain for the period going back to 1950, according to the Stock Trader’s Almanac, though the first half of the month is often more challenging, because people need cash to pay taxes.
Significantly, two occurrences of those 10% first-quarter gains Detrick reviewed took place during election years, with the S&P 500 ending higher on the year. In 1976, the S&P 500 went on to register a 1.5% increase in the second quarter, and a 4.6% jump for the rest of the year. In 2012, the broad market index registered a 3.3% loss in the second quarter, but managed to notch a 1.3% advance for the remainder of the year. So, this being an election year, does add some uncertainty.
Other market strategists reached similar conclusions from the historical data. CFRA Research’s Sam Stovall noted the 15 strongest first-quarter returns since World War II have returned 12.5%, on average, while the subsequent second quarters averaged a 3.7% increase. So, while I believe the stock markets are due for some sort of pullback, the analytics I use, depict a pullback that will be short lived. Besides the analytics, I also like how the markets have finally become more broad based, as last year was so narrow in scope with the Magnificent 7 far outpacing the rest of the S&P 493. In fact, according to CNBC, you would have made about 1% last year if you had the S&P 493, versus the strong gains of the overall S&P 500.
Many investors don’t actually know, but the financial and energy sectors, have both outpaced the technology sector YTD, according to CNBC. I have found many bargains in both the financial and energy sectors. In a couple of the financial names I have many of you in, the companies were trading below book value as we entered 2024. With that said, again I have been very careful to stay away from Regional Banks because of the amount of commercial real estate on their books. While I was about ready to give up on Energy a couple of months ago, I am very glad I didn’t, as Energy has had incredible returns the past couple of months, as depicted below.
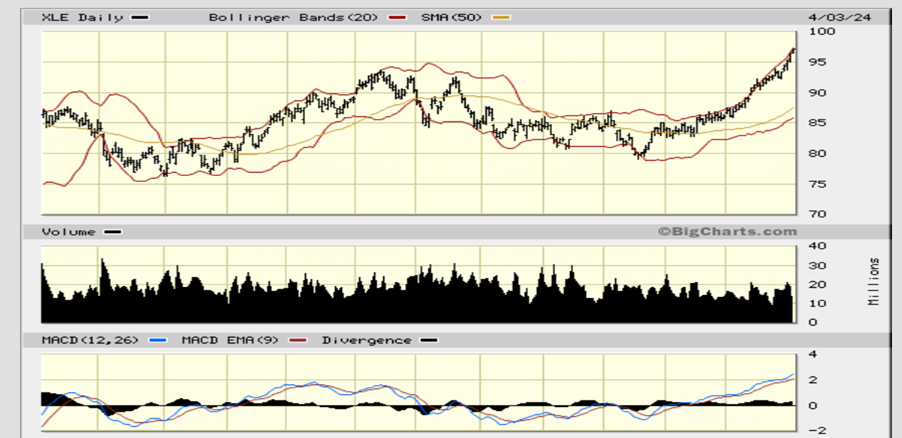
I always felt like any sector that made 9% of the overall S&P profits (as energy did last year), but only has a 4% overall S&P weighting, was bound to have positive movement before too long. Now that is also coming to fruition. I also like plays on the GLP-1 weight loss drugs, which started as diabetes drugs and have now also evolved into heart health drugs. Another secular trend that I think will be around for some time.
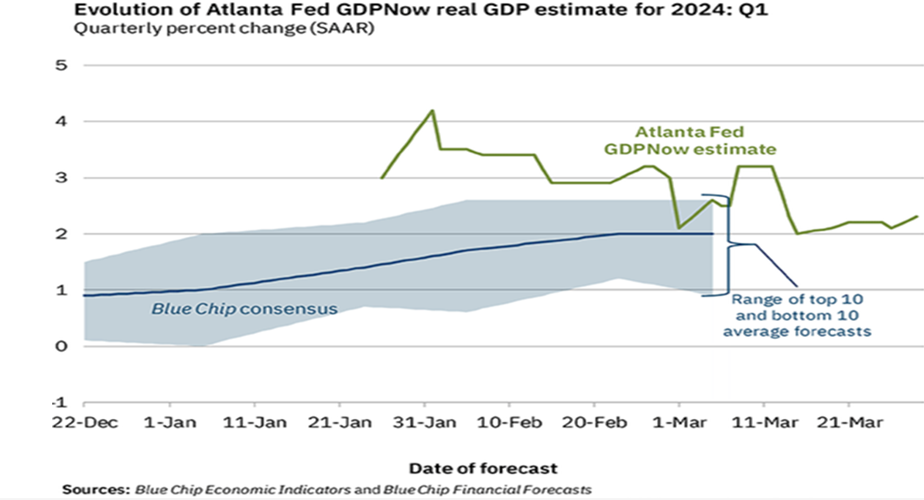
Another indicator that has improved for the first time in almost a year, is the PMI/PPI manufacturing data, and has just gone positive with a recording over 50 (over 50 is expansionary). This has been just one indicator that has shown growth is getting better, as many service and employment trends have depicted strong growth. The GDP remains stubbornly resilient even with much higher interest rates and liquidity being taken out of the market through the Fed’s Quantitative Tightening.
So how am I looking to play these markets if the markets are overpriced in the short-term in my opinion? Especially, when I like many things about the long-term. As I said earlier, there are many ways I keep my clients “in the game”, but also protect them somewhat to the downside. Additionally, I also got into many fixed income areas (such as single corporate bonds or preferred’s), where I am guaranteed certain returns, if I hold these bonds to maturity (usually 1-6 years) if the company doesn’t go bankrupt. Just a lot of things we can do now, that we couldn’t do for about 13 years, when rates were SO low during that period. Great for people with debt, but not necessarily good for people looking for yield from an investment,
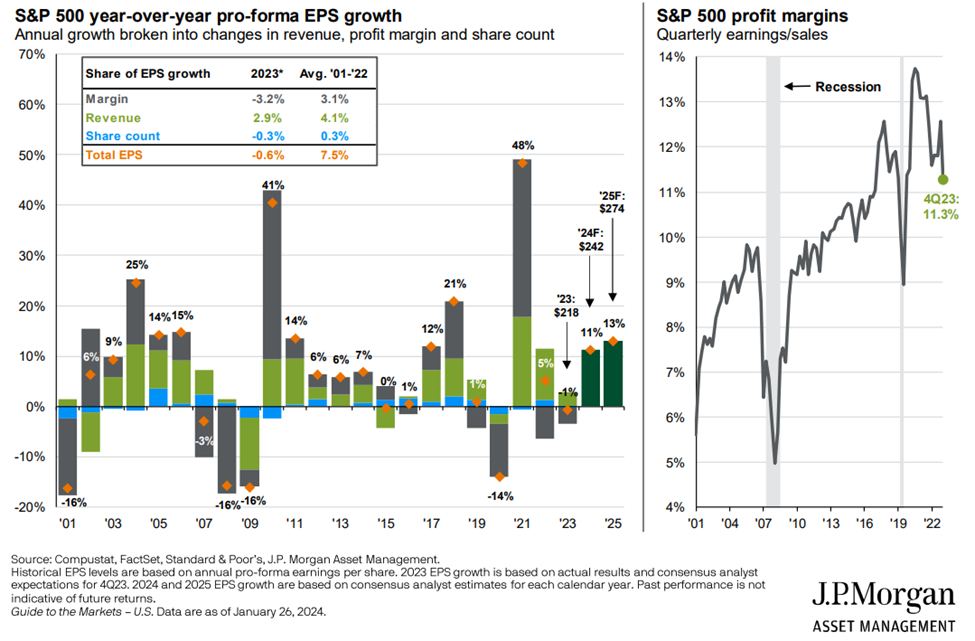
And other reasons I remain bullish long term in most markets, is I really like what I have seen in 1Q24 earnings, and what I have seen in profits, YTD. While I don’t believe earnings growth will be as high as the Street’s 12%, I do believe we will have earnings growth of 9-10% in 2024. And with productivity increases, profit margins have been really good.
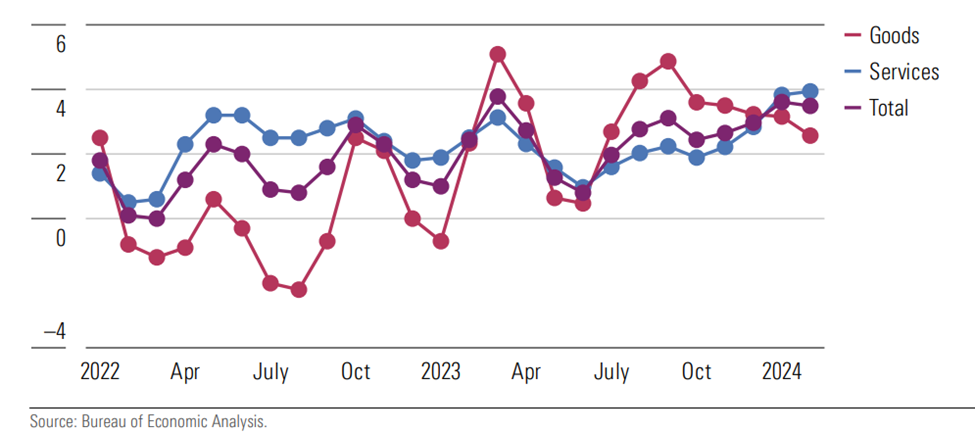
In fact, while I was more worried about reflation a few months ago, Stagflation now seems to be something we really need to keep our eye on, as inflation is certainly acting very sticky as it tries to move from 3% to the 2% level. The last mile always seems to always be the hardest…
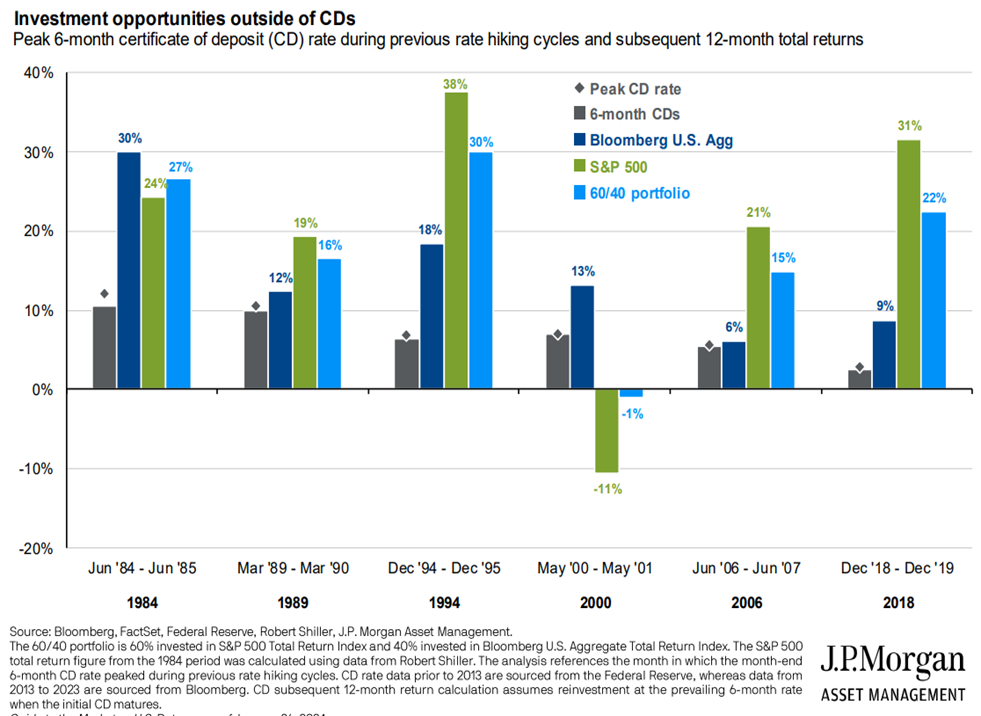
If you believe like I do that rates have peaked, then history also depicts strong returns for fixed income (Bloomberg Agg), the S&P, and blended portfolios in the coming year. The only exception to the last six interest rate peaks was in 2000 (Don’t we all just want to forget that time)!
So, I will summarize as follows: I think there could be some real challenges coming up soon, but I think 2024 will be a good year overall, for both stock and fixed income markets. Taking that a step further, I think rates will be higher for longer, which typically has different results than when the Fed brings rates down quickly. With slow Fed cutting cycle, cyclicals often outperform other parts of the market, which bodes well for many areas such as financials, energy, industrials, and even technology. If the Fed started cutting rates quickly, defensives typically do better, just like when there is also a significant slowdown in the economy. And when you couple the fact that many now feel we will have a very soft landing without a recession, there is a good chance that buying will come to the rescue on any real weakness.
I also want to remind everyone why I almost don’t know anyone that has ever been good at totally timing the markets. The past 15 months have been the perfect example of why to never go all in or all out… Remember the analysts/economists at the start of 2023 after a very difficult 2022? 64% of economists were predicting some kind of recession in 2023 and many analysts were predicting a down year for the S&P 500 and the Dow Industrial averages. Boy, were they ever wrong as the S&P 500 had one of its best years in the last decade, even if it was driven by the Mag 7… But how quickly people move on and forget previous estimates. This is just one more example of why we all should ignore the sensationalists that talk about how they can save us from financial disaster by going all in or all out. Sticking with a consistent, long-term strategy is the only thing that works over time.
Budget Issues will become a problem if not acted on very soon. Source on numbers below: First Trust
The leaders of the House and Senate have come up with a new budget deal, and many people aren’t happy. It still needs passing by January 19th, or else the government, evidently, may shutdown. I doubt that this will happen, but the fight over government spending seems to drag on year after year after year.
It’s not hard to understand why. Non-defense spending by the federal government (including entitlements like Social Security) has climbed dramatically.
· 10% of GDP in the 1960s
· 14.8% of GDP in 2001
· 15.2% of GDP in 2007
· 17.8% of GDP in 2019
· And now, projected at roughly 22% of GDP over the next 5 years.
In other words, non-defense spending now consumes more than twice as much GDP every year as it did 60 years ago. It’s up 24% from the year before COVID. Government continues to take more and more of what the private sector produces, and it is heading for annual deficits of about $2 trillion. The Great Recession and COVID were one-off events. Yet somehow, government spending never returned to pre-crisis levels following either. And because politicians have not been punished at the ballots for such unconstrained spending – or the resulting deficits – they have had little incentive to alter course. This is why budget battles have turned consistently ugly in recent years. Repeated threats to not raise the debt ceiling or shut down the government because a budget can’t be agreed on have become commonplace.
Total debt has ballooned at the same time the Fed lifted artificially low interest rates to fight the inflation that poor policies created, causing net interest expenses to skyrocket. In 2020, the net interest expense was $332.6 billion. In the past twelve months, it has totaled $730.4 billion. The Congressional Budget Office expects net interest expenses to rise to above $1 trillion per year after 2028. Sorry, but that’s nuts! While many think all the US has to do is raise tax rates, history suggests eliminating deficits this way is virtually impossible. The last period the budget was balanced was between 1998 and 2001. During those years, tax receipts averaged an all-time record of 19.4% of GDP, while total spending averaged just 18%. This was the tail end of a miraculous period in modern US history. Starting with Ronald Reagan, and continuing through Bill Clinton, government spending fell as a share of GDP. The less the government spends, the more there is left for private sector growth. Economic growth boomed, and that growth boosted tax receipts.
At some point both government debt and entitlements need to be acted on, before Social Security is unable to pay out full entitlements in 2033. Congress has to move very soon, on both debt and entitlements or there will be serious consequences.
I don’t step in the congressional ring very often in my newsletter, but this will affect the masses if not acted on soon, and I think this will be the key debate in the 2028 elections.
I hope each of you has a wonderful rest of your week and is enjoying the Spring season.
Warmest Regards,
Hunter Hardy CFP®